RESEARCH DEVELOPMENT FOR ADVANCED METHODS SOLUTIONS: AGRICULTURE, HORTICULTURE, NURSERY, AMENITY
PLANTAE SOLUTIONS
LUCIS
LLPhP is Landlab’s high-throughput phenotyping platform, designed to measure plant growth and morphology in a fast, objective and non-destructive way. It combines automated movement with multispectral 3D scanning and generates large, consistent datasets that characterise treatments, genotypes and stress responses over time.
High-throughput phenotyping platform
How the high-throughput phenotyping platform Lucis works – since 2018
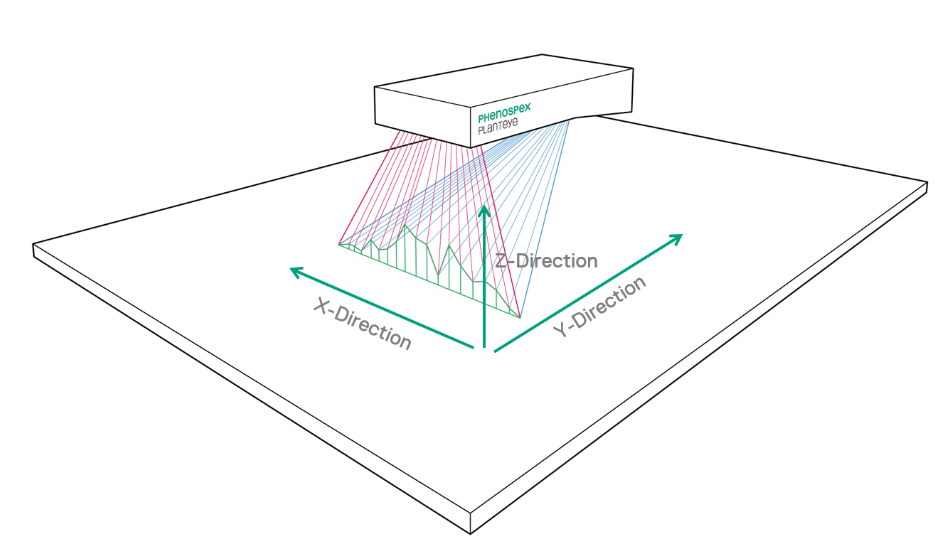
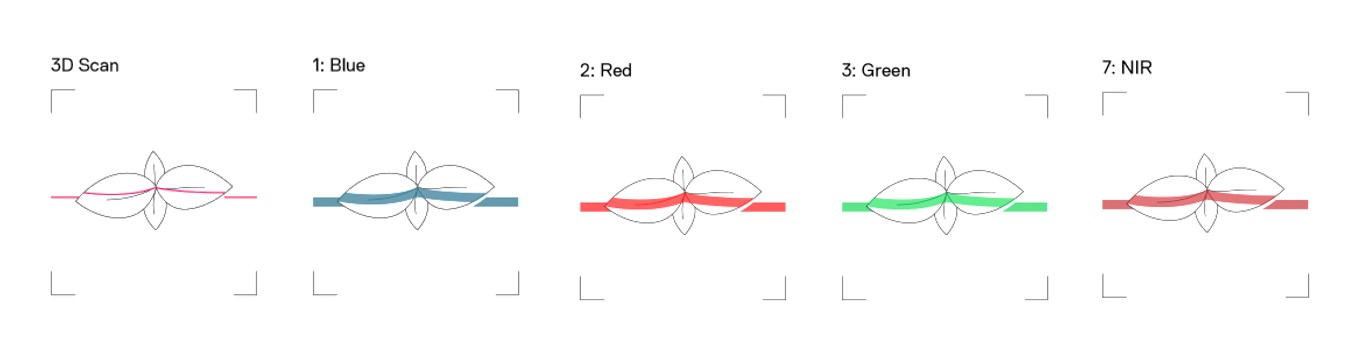
The high-throughput phenotyping platform Lucis (LLPhP) integrates the PlantEye F500 multispectral 3D scanner with a precision movement system that automatically positions plants under the sensor. Each scan collects a detailed 3D point cloud and spectral information. The software then processes these data to extract biometric traits such as height, projected leaf area, volume and digital biomass. It also calculates spectral indices that describe canopy colour, chlorophyll-related signals and stress indicators.
This high-throughput phenotyping platform allows users to follow the same plants over time and to build growth curves and dynamic responses to products, water regimes or environmental conditions. Because the measurements follow an automated and standardised protocol, Lucis reduces operator bias and increases repeatability. This aspect is crucial when you compare treatments or screen large sets of genotypes.
Applications of the high-throughput phenotyping platform
The high-throughput phenotyping platform Lucis supports a wide range of projects, from early screening of biostimulants and fertilisers to advanced studies on mode of action and stress tolerance. Users can quantify the effect of inputs on plant architecture, vigour and light interception. They can also explore how different varieties respond to drought, salinity and other abiotic stresses. The datasets that result from these trials can feed statistical models and help identify the most promising candidates for further testing in greenhouse or field conditions.
Lucis fits into Landlab’s experimental environments, so phenotyping data can be combined with classical agronomic measurements, lab analyses and omics outputs obtained in the Foliae and Biotool platforms. This integrated approach offers a more complete view of plant performance. It also supports product development, registration and marketing claims in the agricultural and biotechnology sectors.
For more technical details on multispectral 3D scanning, you can refer to the PlantEye F500 documentation provided by the manufacturer.
Image by Phenospex
Surface Angle Average average (Color)
Normalized Different Vegetation Index (NDVI)
Normalized Pigments Chlorophyll ratio Index (NPCI)
Plant Senescence Reflectance Index (PSRI)
Greenness
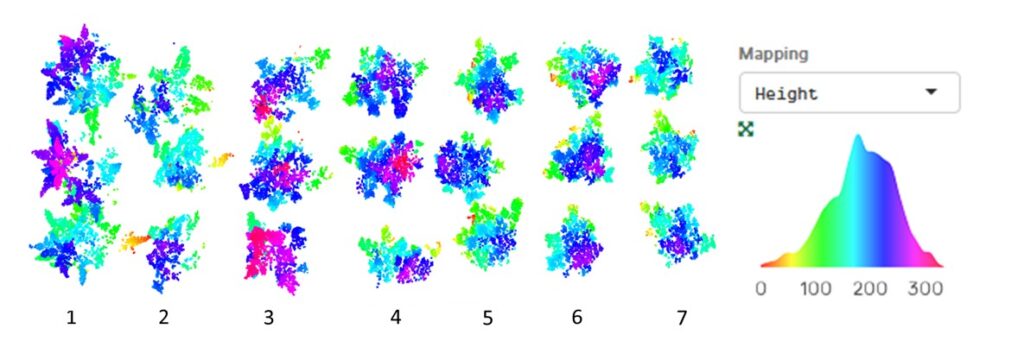
BIOMETRIC PARAMETERS
3D Leaf Area Digital Biomass
Projected Leaf Area
Plant Height Max Plant Height Average
Leaf inclination-leaf angle
Correlation between standard biometric assessments and outputs of the LLPhP in tomato.
For more technical details on multispectral 3D scanning, you can refer to the PlantEye F500 documentation provided by the manufacturer.